Building a SetFit Dataset: The Taxonomy
by Sylvain Artois on Jan 20, 2026
- #setfit
- #nlp
- #text-classification
- #dataset
- #taxonomy

This is Part 2 of my SetFit series. In Part 1, I explained what SetFit is and why it’s useful for few-shot classification. Now let’s talk about the hard part: building the dataset.
Why Taxonomy Matters
Before writing a single line of training code, you need to answer a simple question: what are you classifying, and why?
In my case, the SetFit classifier is the first step of the AFK data pipeline. I have two goals:
-
Prepare headlines for BERTopic clustering: I noticed that BERTopic works better when I can tune its config per semantic field. The hyperparameters that work for “Technology” headlines don’t work for “Politics”. So I need broad categories first, then clustering.
-
Filter out noise: Some headlines are not worth clustering. Weather forecasts, sponsored content, local crime news—I want to skip them before they reach the expensive clustering step.
So my taxonomy needs to serve the pipeline, not be a perfect editorial classification.
First Try: A 15-Category Taxonomy
You can build a taxonomy in two ways:
- Top-down: Start with categories you want (editorial vision)
- Bottom-up: Look at your data and group what you see
In practice, you iterate between both. I started with what I thought were reasonable news categories:
Politique France
Géopolitique mondiale (conflits, diplomatie hors Europe)
Économie & Finance
Technologie
Société & Éthique
Science, Santé & Recherche
Culture
Sport
Climat & Biodiversité
Faits divers & Actualité locale
Outlier
Lifestyle & Consumer (mode, cuisine, gadgets, pub)
Météo
Médias & People
Politique Europe & Francophonie (BE, CH, QC + UE)
15 categories. Seemed reasonable. Let’s see what happened.
Results of the First Attempt
Model: almanach/camembert-base fine-tuned with SetFit
Dataset: 110 samples per class (balanced)
Global accuracy: 74.8%
| Category | Precision | Recall | F1-Score |
|---|---|---|---|
| Météo | 88.1% | 90.2% | 89.2% |
| Géopolitique mondiale | 85.1% | 90.5% | 87.7% |
| Sport | 85.7% | 87.3% | 86.5% |
| Lifestyle & Consumer | 83.1% | 86.8% | 84.9% |
| Faits divers & Actualité locale | 85.7% | 79.6% | 82.5% |
| Culture | 82.8% | 71.6% | 76.8% |
| Technologie | 86.4% | 65.5% | 74.5% |
| Médias & People | 62.5% | 88.2% | 73.2% |
| Science, Santé & Recherche | 69.0% | 66.7% | 67.8% |
| Économie & Finance | 66.7% | 64.5% | 65.6% |
| Politique Europe & Francophonie | 46.2% | 80.0% | 58.5% |
| Politique France | 59.3% | 57.1% | 58.2% |
| Climat & Biodiversité | 48.1% | 61.9% | 54.2% |
| Société & Éthique | 53.3% | 53.3% | 53.3% |
| Outlier | 53.6% | 42.9% | 47.6% |
74.8% accuracy sounds OK, but look at the bottom of the table. Some categories are basically random.
What Worked
Categories with F1 > 80% share a common trait: they have distinctive vocabulary.
- Météo (89.2%): temperatures, rain, snow, forecasts. Almost no overlap with other categories.
- Sport (86.5%): team names, scores, competitions. Very specific words.
- Géopolitique (87.7%): country names, conflicts, diplomatic terms.
- Lifestyle (84.9%): products, brands, recipes. Distinct from “hard news”.
SetFit’s contrastive learning is good at capturing these patterns. If a category has unique words, the model learns them fast.
What Failed
Three patterns of failure:
Pattern 1: Over-prediction (high recall, low precision)
| Category | Precision | Recall |
|---|---|---|
| Politique Europe | 46.2% | 80.0% |
| Médias & People | 62.5% | 88.2% |
| Climat & Biodiversité | 48.1% | 61.9% |
The model catches most true positives but produces many false alarms. For “Politique Europe”, any mention of “Brussels” or “EU” triggers the prediction—even when the article is about economics.
Pattern 2: Under-prediction (high precision, low recall)
| Category | Precision | Recall |
|---|---|---|
| Technologie | 86.4% | 65.5% |
| Culture | 82.8% | 71.6% |
The model learned a narrow definition. For “Technologie”, it probably knows “startup” and “AI” but misses articles about tech regulation or tech companies’ business news.
Pattern 3: Fundamental taxonomy problems (low both)
| Category | Precision | Recall | F1 |
|---|---|---|---|
| Société & Éthique | 53.3% | 53.3% | 53.3% |
| Outlier | 53.6% | 42.9% | 47.6% |
| Politique France | 59.3% | 57.1% | 58.2% |
These categories have deeper problems. “Société & Éthique” is a catch-all: immigration debates overlap with Politics, bioethics overlaps with Science, social inequalities overlap with Economics. The category itself has no clear semantic signature.
“Outlier” is by definition heterogeneous—it’s a bucket for “everything else”. SetFit cannot learn a pattern for “miscellaneous”.
The Real Lesson
A common misconception: SetFit failures come from insufficient data.
But I had 110 samples per class. That’s generous for SetFit, which works with 8-64 samples.
The actual problems:
- Some categories have no clear semantic boundaries
- Multiple categories can legitimately claim the same headline
- “Outlier” and “Société & Éthique” lack coherent definitions
No amount of training data will fix a poorly designed taxonomy. If human annotators struggle to consistently assign labels, the model will too.
Measuring Taxonomy Quality with Embeddings
At this point, I wanted numbers—not just intuition. I wrote a small tool that uses the embeddings already stored in Qdrant to analyze taxonomy quality without re-training anything.
The idea is simple:
- Compute centroids: For each category, calculate the average embedding of all headlines
- Measure inter-centroid distances: How far apart are the category centers? (farther = better separation)
- Measure intra-cluster variance: How spread out are headlines within each category? (lower = more coherent)
- Find ambiguous headlines: Which headlines are equally close to multiple centroids?
V1 Taxonomy Analysis
============================================================
INTER-CENTROID DISTANCES (lower = more overlap)
============================================================
  [CLOSE] Culture <-> Outlier: 0.2601
  [CLOSE] Société & Éthique <-> Politique France: 0.2884
  [OK] Science, Santé & Recherche <-> Outlier: 0.3126
  [OK] Société & Éthique <-> Outlier: 0.3208
  ...

============================================================
SUMMARY METRICS
============================================================
  Average inter-centroid distance: 0.5164 (target: > 0.3)
  Minimum inter-centroid distance: 0.2601 (target: > 0.2)
  Average intra-cluster variance:  0.008015 (target: < 0.05)
  Ambiguity rate: 66.7% (target: < 10%)
66.7% ambiguity rate. Two-thirds of headlines are semantically close to multiple categories. That’s not a training problem—that’s a taxonomy problem.
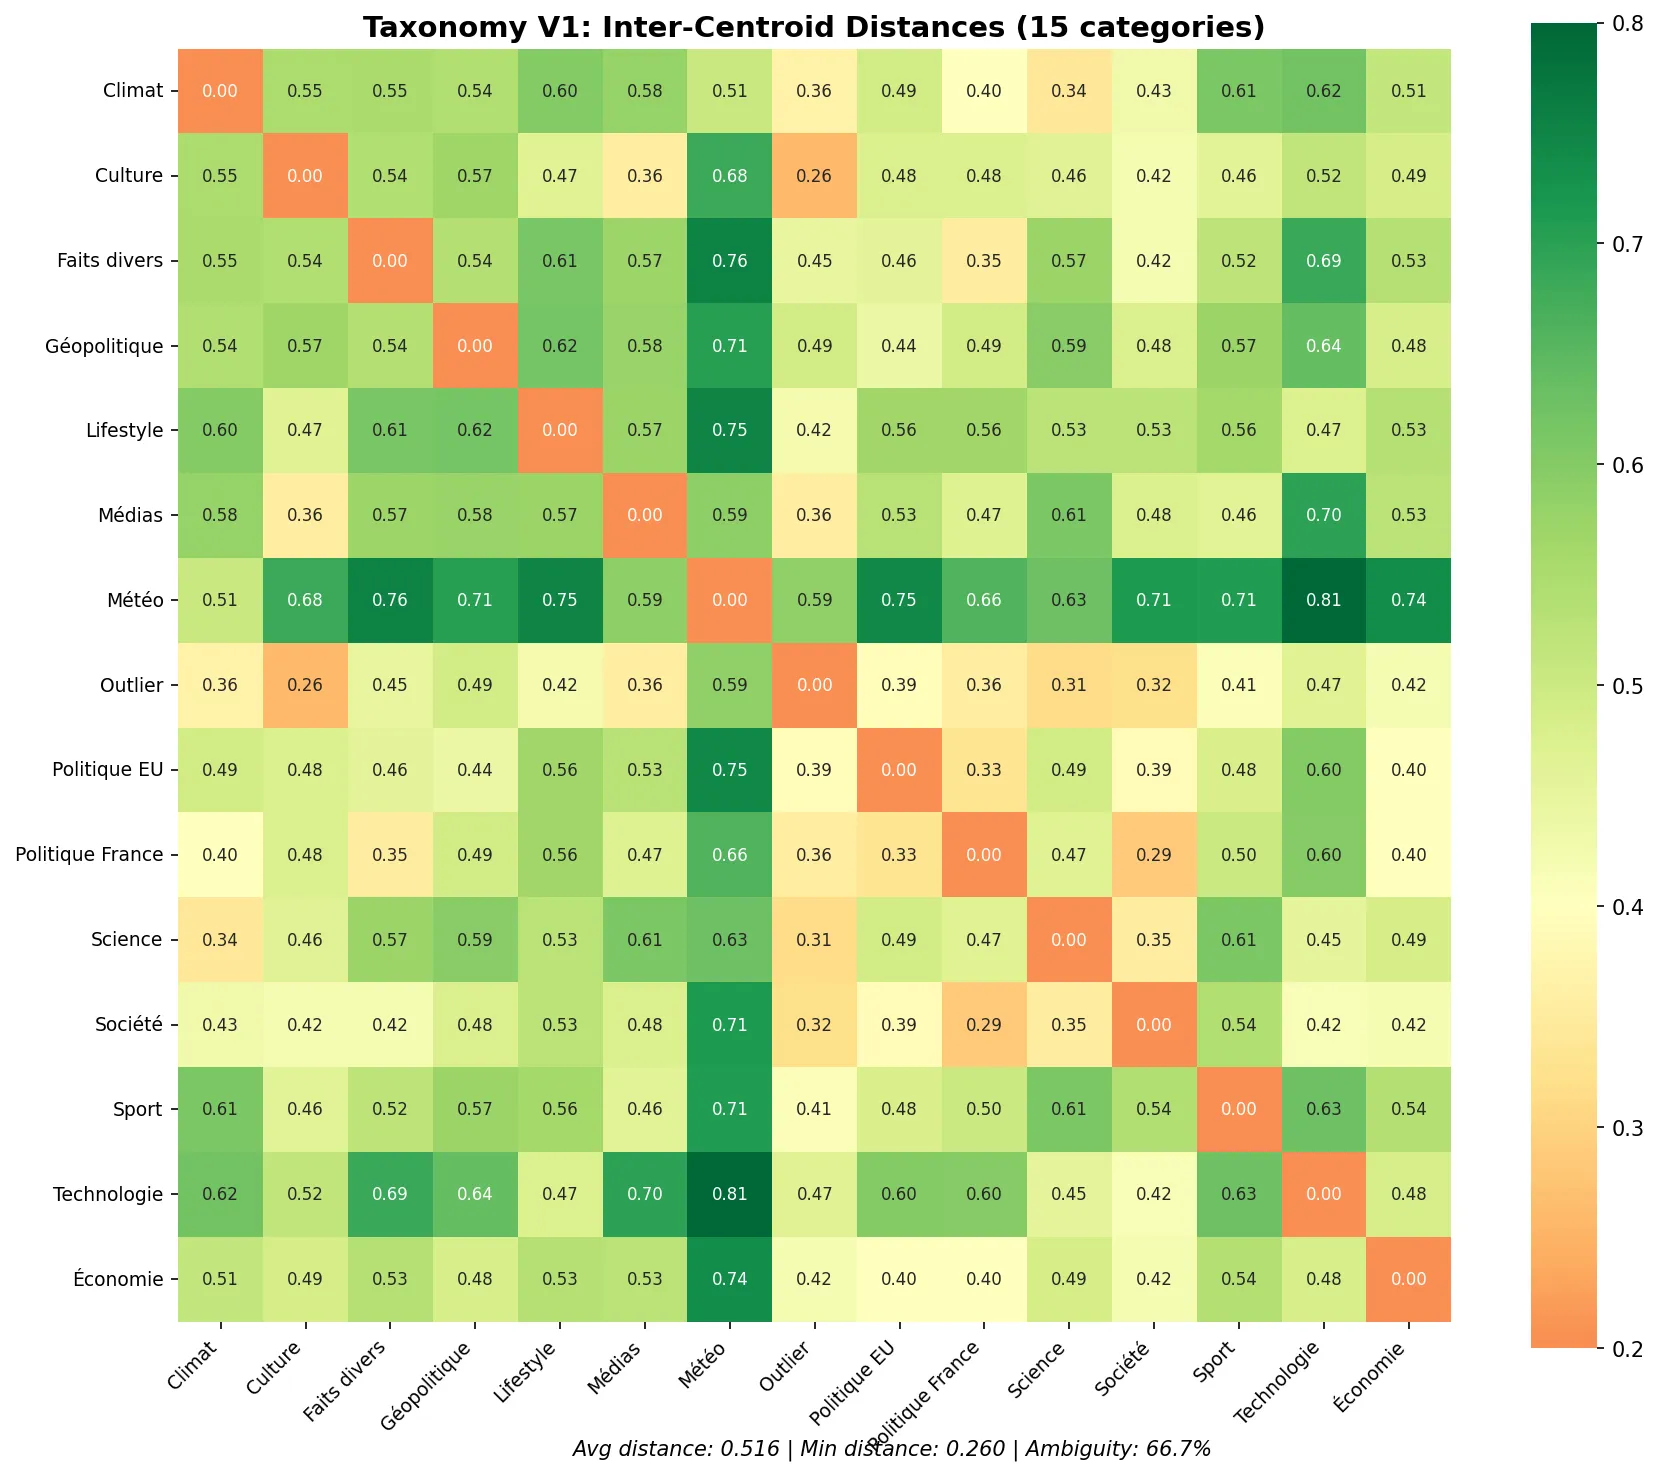
The heatmap shows inter-centroid distances. Red cells mean categories are too close (overlap). Green cells mean good separation.
Look at “Culture <-> Outlier” (0.26) and “Société <-> Politique France” (0.29). These pairs are dangerously close in embedding space. The model cannot separate them reliably.
The top confusing pairs:
- Culture <-> Outlier: 87 ambiguous headlines
- Politique France <-> Société & Éthique: 74 ambiguous headlines
- Climat & Biodiversité <-> Science: 64 ambiguous headlines
- Faits divers <-> Politique France: 63 ambiguous headlines
Questions Before Redesigning
Before building V2, I asked myself:
- Is each category actionable? Does it serve the BERTopic goal, or is it just editorial polish?
- Can a human annotator consistently distinguish between categories? If not, merge them.
- Does each category have distinctive vocabulary? If not, it won’t be learnable.
- Are there implicit sub-categories? Maybe “Politique” should be one category, not two.
- Should “Outlier” exist? A bucket for “everything else” is unlearnable.
A New Try: The V2 Taxonomy
I reduced from 15 to 12 categories, focusing on semantic distinctiveness:
Politique FR, EU, Québec
Géopolitique mondiale
Economie & Marchés & Business Tech
Société
Science & Environnement
Culture
Sport
Faits divers & Actualité locale
Gadgets, pub, articles sponsorisés
Météo
Rediffusion, replay, programme TV
Code & Infrastructure
Key changes:
- Merged “Politique France” and “Politique Europe” into one “Politique” category. The distinction was too subtle.
- Removed “Outlier”. Instead, I added specific categories for noise I want to filter: “Gadgets/pub”, “TV/Replay”.
- Merged “Science” and “Climat” into “Science & Environnement”. Less overlap.
- Added “Code & Infrastructure” for tech articles about infrastructure, DevOps, etc. (specific to my use case)
- Removed “Médias & People”. It was overlapping with Culture and Société.
The philosophy: think pipeline, not editorial perfection. Wide positive categories for clustering, precise negative categories for filtering.
V2 Results
Model: almanach/camembert-base fine-tuned with SetFit
Dataset: 60 samples per class (smaller but cleaner)
Global accuracy: 80.6%
| Category | Precision | Recall | F1-Score |
|---|---|---|---|
| Gadgets, pub, articles sponsorisés | 95.0% | 100.0% | 97.4% |
| Code & Infrastructure | 93.3% | 93.3% | 93.3% |
| Sport | 100.0% | 84.2% | 91.4% |
| Rediffusion, replay, programme TV | 89.5% | 89.5% | 89.5% |
| Météo | 88.2% | 88.2% | 88.2% |
| Culture | 77.8% | 87.5% | 82.4% |
| Economie & Marchés & Business Tech | 78.9% | 83.3% | 81.1% |
| Politique FR, EU, Québec | 71.4% | 87.0% | 78.4% |
| Science & Environnement | 75.0% | 75.0% | 75.0% |
| Faits divers & Actualité locale | 63.6% | 82.4% | 71.8% |
| Géopolitique mondiale | 80.0% | 53.3% | 64.0% |
| Société | 54.5% | 35.3% | 42.9% |
Notice:
- Filter categories work great: Gadgets (97%), TV/Replay (89%), Météo (88%). These are the ones I need to filter noise.
- Wide categories are OK: Culture (82%), Economie (81%), Politique (78%). Good enough for BERTopic prep.
- Société is still weak (43%). That’s fine—I’ll let BERTopic handle the nuance later.
V2 Taxonomy Analysis
============================================================
SUMMARY METRICS
============================================================
  Average inter-centroid distance: 0.5921 (target: > 0.3)
  Minimum inter-centroid distance: 0.3064 (target: > 0.2)
  Average intra-cluster variance:  0.008888 (target: < 0.05)
  Ambiguity rate: 50.2% (target: < 10%)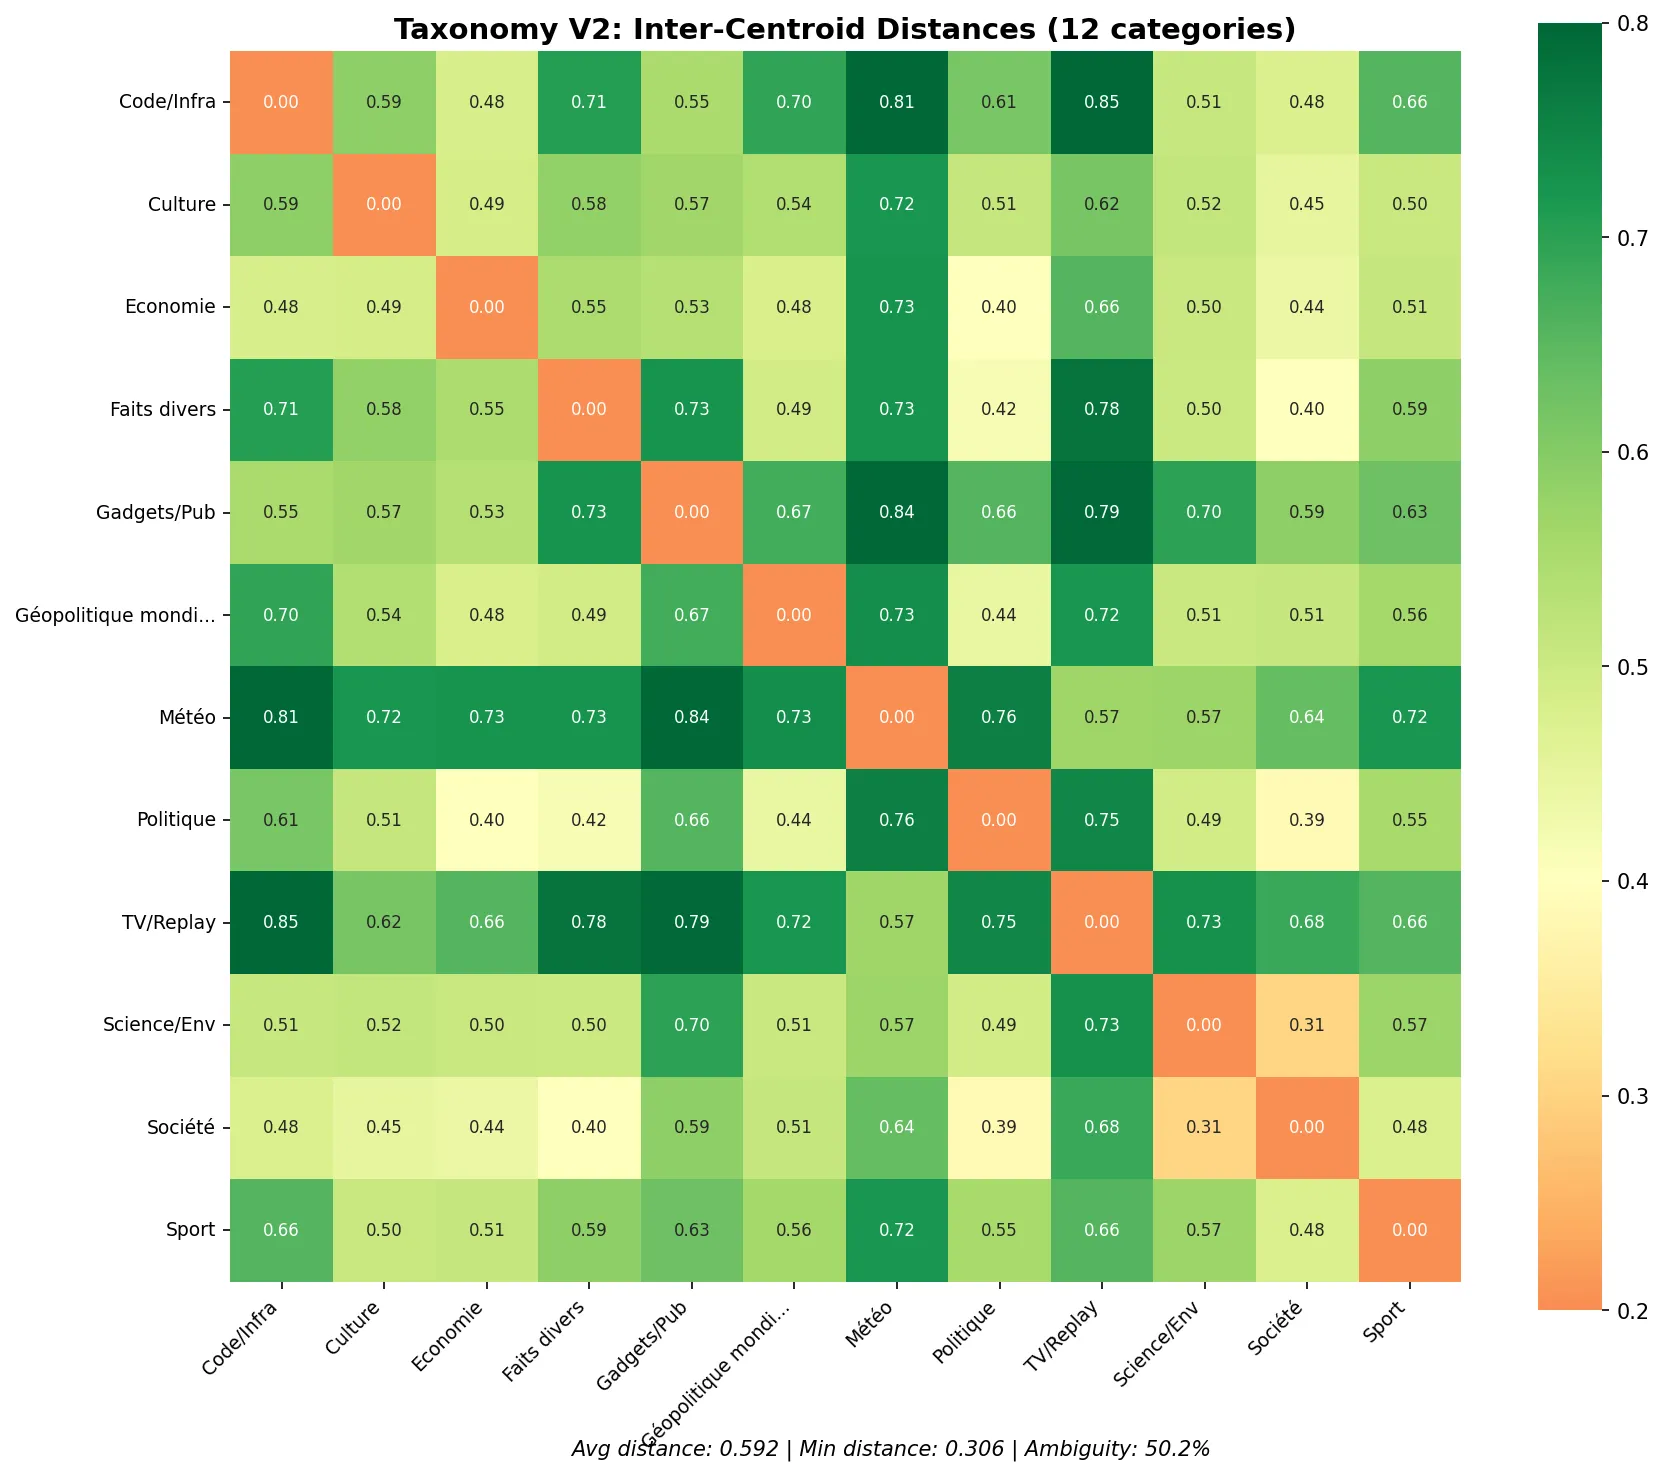
Improvement:
- Average distance: 0.52 → 0.59 (better separation)
- Minimum distance: 0.26 → 0.31 (less dangerous overlap)
- Ambiguity rate: 66.7% → 50.2% (still high, but better)
The closest pair is now “Société <-> Science & Environnement” at 0.31, which is above the danger zone.
Comparing V1 and V2
| Metric | V1 (15 categories) | V2 (12 categories) |
|---|---|---|
| Accuracy | 74.8% | 80.6% |
| Avg inter-centroid distance | 0.516 | 0.592 |
| Min inter-centroid distance | 0.260 | 0.306 |
| Ambiguity rate | 66.7% | 50.2% |
| Filter categories F1 | ~85% | ~90%+ |
Less categories, better results. Sometimes less is more.
Think Pipeline
The key insight: a SetFit classifier doesn’t need to be perfect.
In my pipeline:
- SetFit filters obvious noise (Météo, Gadgets, TV) with high precision
- SetFit groups headlines into broad semantic buckets
- BERTopic does the fine-grained clustering per bucket
- An LLM does final editorial work on the small clustered output
Each step does what it’s good at. SetFit is good at broad strokes with little data. It’s not good at subtle distinctions between overlapping categories.
Design your taxonomy for the tool, not for human readers.
What’s Next
In Part 3, I’ll cover the practical work of building the dataset:
- Using SQL to sample headlines from the database
- Using an LLM to pre-classify before human review
- Building a Streamlit tool for efficient manual labeling
- Pushing the final dataset to Hugging Face
This article is part of my journey learning ML as a senior engineer without a data science background. I’m documenting what I learn, including the mistakes.